Exploring Vega
04/08/2017
When I start to build web visualizations I consider a low level
library like d3.js or high level charting library like
chart.js. I’ll usually choose a high level charting library unless
I intend to make something custom. The problem is, as with most web
libraries, the charting libs are constantly changing and that means
new APIs every bloody time I want to create some new charts. Seriously,
choosing a charting library can be a pain and there are plenty of
options.
Every time I revisit this problem I ask “why the hell are there not any
standards?” The fundamentals of a pie chart are known, yet for example
chart.js and highcharts have different APIs to create and modify them.
That’s where Vega comes in.
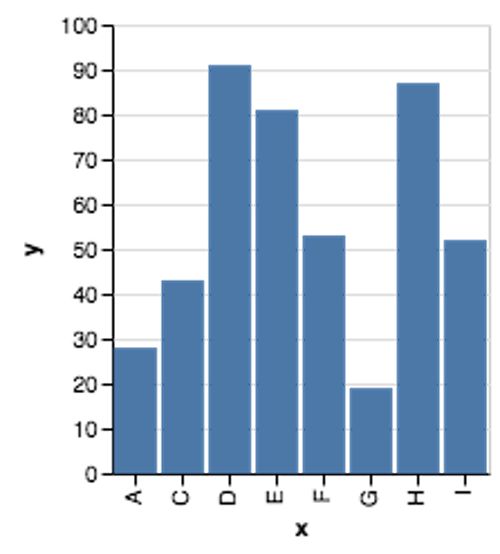
Vega is a visualization grammar. It is a standard way of describing visualizations which can be implementation agnostic. You create a chart specification in JSON and then pass it on to some library to actually draw the visualization. Vega comes with built in libraries to generate web-based views using Canvas or SVG but it’s real power is in the spec, and I could imagine people creating libraries that generate vega views on other platforms. A simple bar chart in Vega-lite, which is a higher level API to generate Vega specs, will look like:
const spec = {
    "$schema": "https://vega.github.io/schema/vega-lite/v2.json",
    "description": "Simple bar chart",
    "data": {
        "values": [
            {"x": "A", "y": 28}, {"x": "y", "B": 55}, {"x": "C", "y": 43},
            {"x": "D", "y": 91}, {"x": "E", "y": 81}, {"x": "F", "y": 53},
            {"x": "G", "y": 19}, {"x": "H", "y": 87}, {"x": "I", "y": 52}
        ]
    },
    "mark": "bar",
    "encoding": {
        "x": {"field": "x", "type": "ordinal"},
        "y": {"field": "y", "type": "quantitative"}
    }
};
Which will produce a chart like this:
Full angular example source code available here