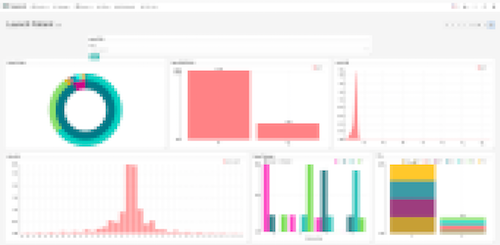
Exploring genomic data with Superset
18/08/2017

As part of a recent hackathon we wanted to explore visualization tools
that could help diagnose rare diseases. A critical
part of the diagnoses process is to compare variations of the patients
genetic information with reference information. There can be lots of
variations, we are talking in the order of millions sometimes tens of
millions per patient. I think a centralized tool that researchers
can use to explore their genomic data and share useful
visualizations is missing. In the business world these kind of tools
have been around for a while, they are generally called
business intelligence applications and one such tool is Superset.
Superset is an open source business intelligence tool built by airbnb. It lets you create interactive dashboards and connects to any database that supports SQLAlchemy.
Deployment
Deployment was simple and straightforward. Just follow the instructions and you’ll be running a superset instance in under 10min. If you followed the instructions you should also have some example data to play with.
Data
Once you have the Superset app running you’ll want to connect it to a database with your genomic information. For simplicity we concentrated on patient VCF data only. In genomics there is no standard database or schema for storing these variants. In fact I would say it’s one of the challenges in our industry at the moment but I’ll save that discussion for another blog post. Luckily for us we already have a pipeline that produces an sqlite database through Gemini. For performance reasons we exported that data into a memsql server. Alternatively you could simply import a VCF into Hail and export a csv to be imported into any database that supports SQLAlchemy.
Usage
The following are some thoughts based on a days usage of Superset:
Positives:
- It’s really easy connect to any database that supports SQLAlchemy.
- It’s easy to create custom dashboards with filters across multiple charts.
- Permissions and roles baked in.
- There’s support for queuing SQL jobs through something they call
SQL Lab. - Visualizations are reusable and easily sharable.
- SQL queries/results are reusable and easily sharable.
- You can create visualizations from saved SQL queries. Creating a new datasource in the process.
Negatives:
- The application seems to be driven around time series. There are lots of time specific visualizations and even visualizations you would think are not time specific, have time specific attributes.
- The number of charts types is quite limited and it’s not easy to add new ones.
- A lot of the charts feel like they have been designed for specific types of data. For example you cannot set x,y domains directly in the
bubblechartinstead you have to pick aseriesand setmetrics. This is common in other charts like thedistributionandhistogram. - No support of dynamic binning so you have to write the binning query yourself in SQL, but it’s easy to create an entirely new visualization for the area you are interested in.
- No cross-dimensional chart interaction, but it is easy to create filters.
Conclusion
I think Superset is a nice visualization tool and let’s you explore large SQL datasets quickly. Keep in mind that a lot of the visualizations are quite simple and any customization requires knowledge of SQL.
From a genomics perspective I think Superset is lacking the visualizations that would make it useful. That being said I could imagine a team of people customizing Superset for genomics. A lot of the fundamental features are there and given some genomic specific visualizations, I think it could become a useful tool in genomics.